


Every subscription brand I talk to watches two numbers: how many subscribers it added this month, and how many it lost. The market data behind those numbers is spread across research firms, platform reports and consumer surveys. A lot of what gets quoted online is years old, or has no source at all.
So we collected more than 60 subscription commerce statistics that hold up as of November 2026. Each one links to its original source and carries a date. They are grouped into five parts: market size, how subscribers buy, what consumers say, churn and retention, and failed payments.
Two notes on method. Where a number is a vendor's claim about its own product, we say so. Where research firms disagree, we show the disagreement instead of picking the biggest number.
Key takeaways
- Market sizing depends on the definition. Estimates for 2025 range from $393 billion to $2.72 trillion for "subscription ecommerce" alone.
- Growth is slowing. Recurly measured subscription growth at 12.6% in its 2026 report, and nearly one in four new subscriptions now comes from a former customer.
- Churn is front-loaded. On Recharge, about 61% of voluntary cancellations happen at the first two renewals.
- Consumers want control: 78% want to pause or swap, and 82% are more likely to subscribe when cancelling is easy (Chargebee, 2025).
- Payment failures cause about a third of churn on Recurly's network, and most of it can be recovered with retries, dunning, card updates and tokens.
Subscription market size and growth
Start with the headline numbers, and read the fine print. The four forecasts below measure different things, which is why they differ by a factor of seven or more.
- $722 billion to $1.2 trillion: Juniper Research expects the global subscription economy to grow 67% between 2025 and 2030 (Juniper Research, Oct 2025).
- Over 33%: Juniper expects digital video to account for over a third of global subscription spend by 2030, so physical product subscriptions are a minority of the total (Juniper Research, Oct 2025).
- 40.6%: North America's share of the subscription ecommerce market in 2025, according to Fortune Business Insights (updated Oct 2026).
- About 7x: the gap between IMARC's $393 billion and Fortune Business Insights' $2.72 trillion for the same market in the same year. If you quote either, name the firm and its definition.
- $27.7 billion: the global subscription box market in 2025, forecast to reach $79.7 billion by 2035 (Global Market Insights, Sep 2026).
- 11% faster: companies in Zuora's Subscription Economy Index grew revenue 11% faster than the broader economy over two years (Zuora, Apr 2025; based on 600+ companies on Zuora Billing).
- 25%: the increase in unique subscribers at those companies over the same two years (Zuora, Apr 2025).
- 12.6%: overall subscription growth in Recurly's 2026 State of Subscriptions report, down from 15.4% a year earlier (Recurly, 2026; prior-year figure via Subscription Insider, Jan 2026).
- Nearly 1 in 4: new subscriptions on Recurly's network now come from a former customer (Recurly, Jan 2026; 2,200+ businesses).
- 50% to 60%: how much more revenue per user annual plans generate than monthly plans (Recurly, Jan 2026).
- 20,000+ brands and $20 billion+: after acquiring Skio, Recharge powers more than 20,000 brands and over $20 billion in annual subscription GMV (Recharge, Apr 2026).
- 100 million: subscribers served by brands on Recharge (Recharge, Sep 2024).
- More than 11%: the share of US adults who have had a subscription powered by Ordergroove, whose GMV grew at a 55% compound annual rate over five years (Ordergroove, Mar 2024).
- 155 million: active subscriptions in the UK, of which nearly 10 million are unwanted (UK Department for Business and Trade, Nov 2024).
- 15%: the share of online shoppers with at least one ecommerce subscription in McKinsey's 2018 survey of 5,093 US consumers. It is old, but still the most-cited baseline (McKinsey, Feb 2018).
How subscribers buy
Platform data shows what subscribers do once they sign up. Most of it comes from Recharge, the largest Shopify subscription platform, so read it as Shopify-heavy DTC data.
- Nearly 3x: subscribers place nearly three times as many orders as one-time shoppers (Recharge Subscription Trend Report, 2026).
- 16%: the rise in subscription checkouts relative to one-time purchases (Recharge, 2026).
- 4.4 orders: what the typical brand's subscribers placed each in a year, up 15% on the prior year (Recharge, Sep 2024).
- 53%: the share of subscribers who adjusted an order, such as a skip or swap, in the past year (Recharge, Sep 2024).
- 25%: growth in total subscribers at Recharge's top stores in 2024 (Recharge, May 2025).
- 2.7 to 2.3: subscriptions per subscriber fell between 2022 and 2024. Brands are adding subscribers, but each one holds fewer subscriptions (Recharge, May 2025).
What consumers say about subscriptions
Consumer surveys explain why growth is slowing. People are spending more on subscriptions, losing track of them, and pruning the ones they don't use. The CNET figures below are from its 2026 survey as reported by local news outlets, because cnet.com was not reachable for verification.
- $111 a month: what Americans spend on subscriptions on average, up 23% year on year (CNET 2026 survey via WFSB, Jul 2026).
- $252 a year: the average spent on subscriptions people don't use, up from $204 in 2025 (CNET 2026 survey via ABC7, Jul 2026).
- $29 and $27 a month: what millennials and Gen Z waste on unused subscriptions, the most of any generation (CNET via ABC7, Jul 2026).
- $133 a month: how much consumers underestimated their subscription spend in a 2022 test. They guessed $86; itemised, it was $219 (C+R Research, May 2022; n=1,000, US).
- 1 in 3: Americans pay for a subscription they never use, and 35% have lost track of their monthly subscription spend (Bango, Sep 2024; 15,000+ consumers).
- 52%: the share of consumers who cancelled at least one subscription in the past year because they weren't using it (Recurly, 2026).
- 47%: of consumers who cancelled a subscription in 2024 cited a price increase (Zuora and The Harris Poll, Apr 2025; n=3,087, US).
- 68%: subscribed to a new service for the first time in 2024 (Zuora and The Harris Poll, Apr 2025).
- 36%: have cancelled a subscription and rejoined the same service less than a year later (Zuora Subscribed Institute, Dec 2024).
- 82%: are more likely to subscribe when they know cancelling is easy (Chargebee, Sep 2025; n=1,454, US and UK).
- 78%: want the option to pause or swap a subscription (Chargebee, Sep 2025).
- 58%: have paused a subscription instead of cancelling when given the option (Chargebee, Sep 2025).
- 44%: say subscriptions take a moderate or significant bite out of their budget (Chargebee, Sep 2025).
- 57%: of Americans say they spend too much on subscriptions, and 40% feel oversubscribed (Motley Fool Money, Mar 2024; n=2,000, US).
- About 50% vs 29%: roughly half of Gen Z and millennials feel oversubscribed, against 29% of boomers (Motley Fool Money, Mar 2024).
- 56% and 55% vs 29%: Gen Z and millennials are about twice as likely as boomers to hold six or more subscriptions (Motley Fool Money, Mar 2024).
- 39%: of US consumers cancelled at least one paid streaming service in the previous six months. Streaming is not DTC, but it sets the habit consumers bring to every subscription (Deloitte Digital Media Trends, Mar 2025; n=3,595).
- £1.6 billion a year: what UK consumers spend on unwanted subscriptions, about £14 a month per subscription (UK Department for Business and Trade, Nov 2024).
If cancellation reasons are your next question, our guide on why people cancel subscriptions goes through them one by one.
Churn and retention benchmarks
The most useful churn data for DTC brands comes from two sources: Recurly's network benchmarks and Recharge's renewal-cycle analysis. They measure churn differently, so compare each brand with the source that matches how it calculates churn.
- 3.60%: the median churn rate across all industries on Recurly's network (Recurly, July 2026 data). Recurly labels these medians "annual"; check the period before you compare them with a monthly churn figure.
- 4.25%: the median churn rate for ecommerce, including subscription boxes and DTC: 2.87% voluntary and 1.38% involuntary (Recurly, July 2026).
- 4.29% vs 2.87%: plans with $10 to $25 average revenue per customer churn more than plans at $100 to $250 (Recurly, July 2026).
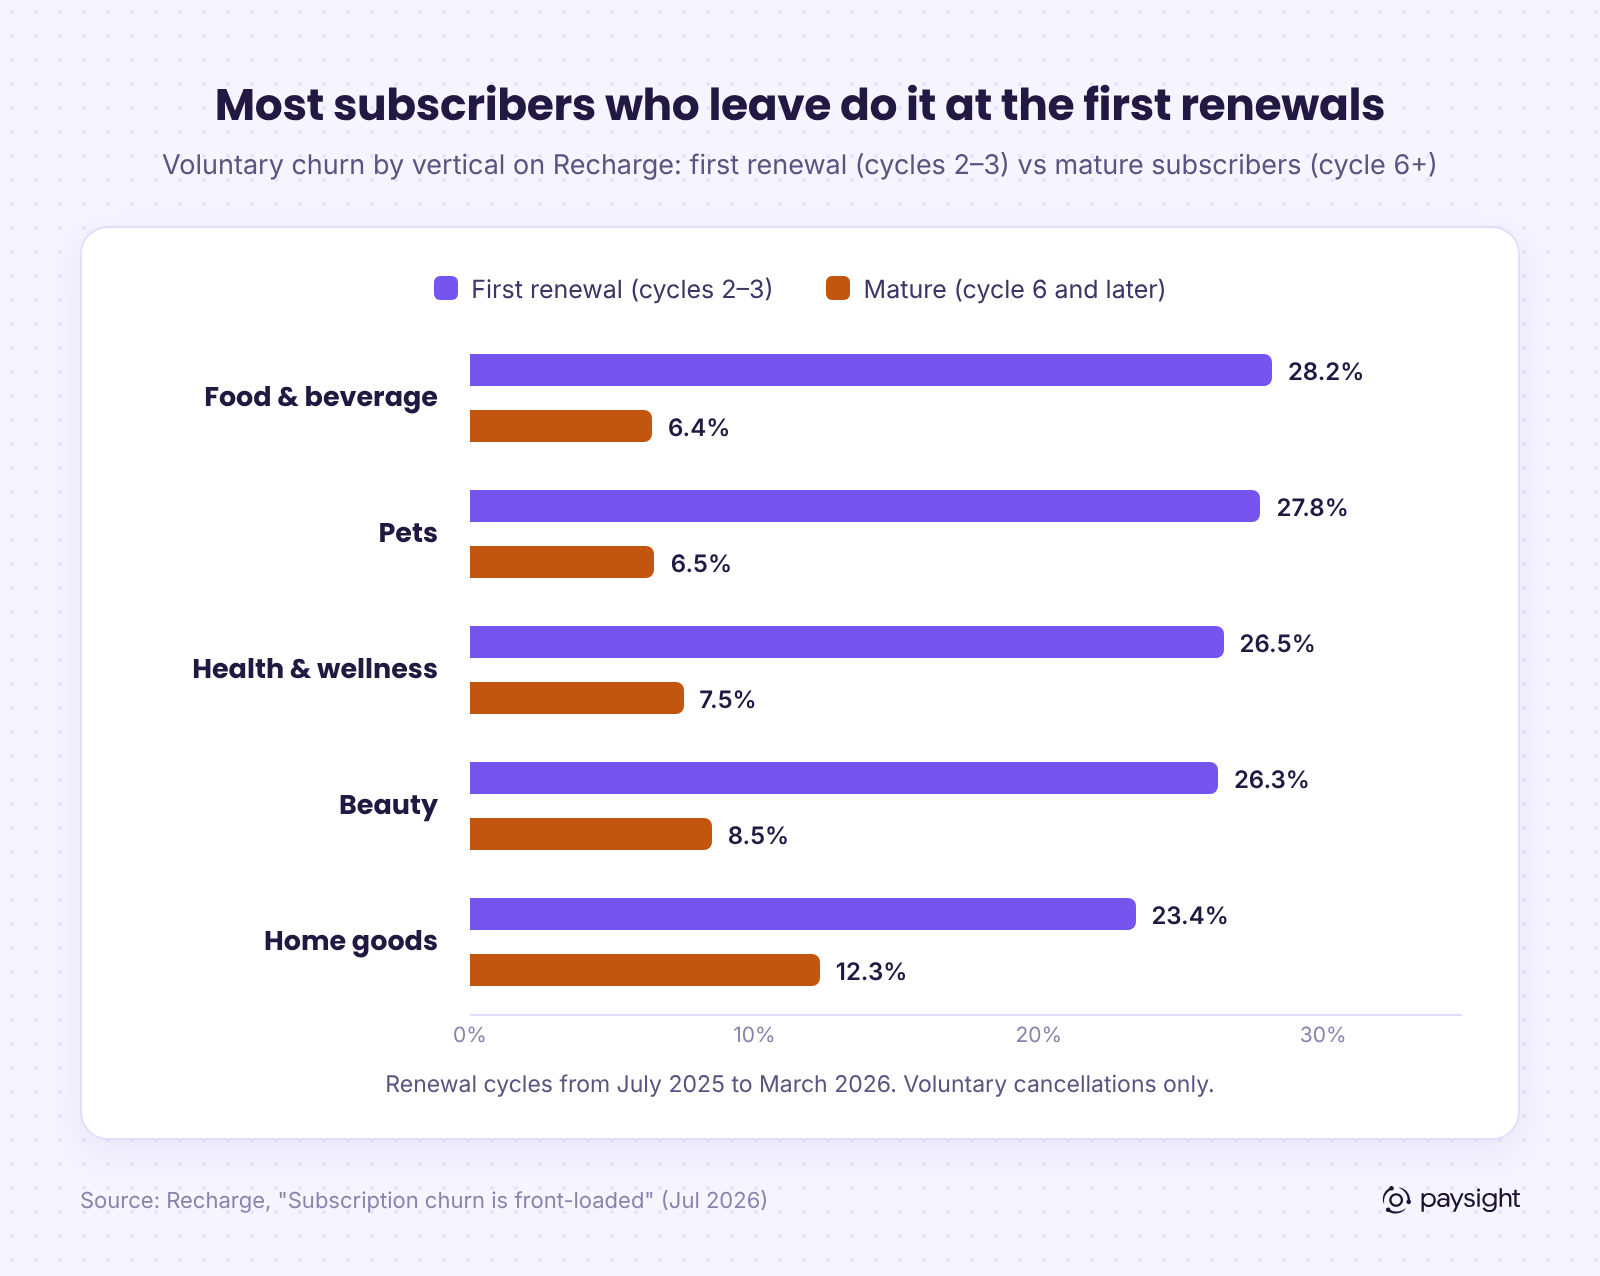
- 24.1% and 27.1%: voluntary churn at the first and second renewal on Recharge (Recharge, Jul 2026; renewal cycles from July 2025 to March 2026).
- 5.4% and 2.4%: churn falls to 5.4% by the 12th cycle and 2.4% from the 13th cycle on (Recharge, Jul 2026).
- 61% and 72%: about 61% of voluntary cancellations happen at the first two renewals, and roughly 72% within the first four (Recharge, Jul 2026).
- 28.2%: food and beverage has the highest first-renewal churn of the major verticals, against 6.4% for mature subscribers (Recharge, Jul 2026).
- 12.3%: home goods has the highest mature churn (cycle 6 and later), nearly double food and beverage or pets (Recharge, Jul 2026).
- More than a third: of ecommerce subscribers cancelled within three months in McKinsey's 2018 survey, and over half within six (McKinsey, Feb 2018).
- 25%: of subscribers paused instead of cancelling at businesses that offered a pause option (Recurly, Jan 2025).
- 337%: the rise in pause usage at businesses offering "pause before cancel" (Recurly, Jan 2026).
- 75%: of customers who pause eventually return (Recurly, Jan 2026).
- 19%: the acceptance rate of pause offers across all cancellation sessions in Churnkey's 2024 data, from about 3 million sessions (Churnkey, 2025; Churnkey sells cancel flows).
- 700,000+: subscriptions saved by Recharge's cancellation prevention tool, by Recharge's own count (Recharge, Feb 2026).
- 5 to 25 times: how much more it costs to acquire a customer than to keep one, depending on the study (Harvard Business Review, Oct 2014).
Failed payments and involuntary churn
Involuntary churn is the part of churn a brand can fix without changing its product. A renewal fails, the card isn't updated, and a subscriber who meant to stay is gone.
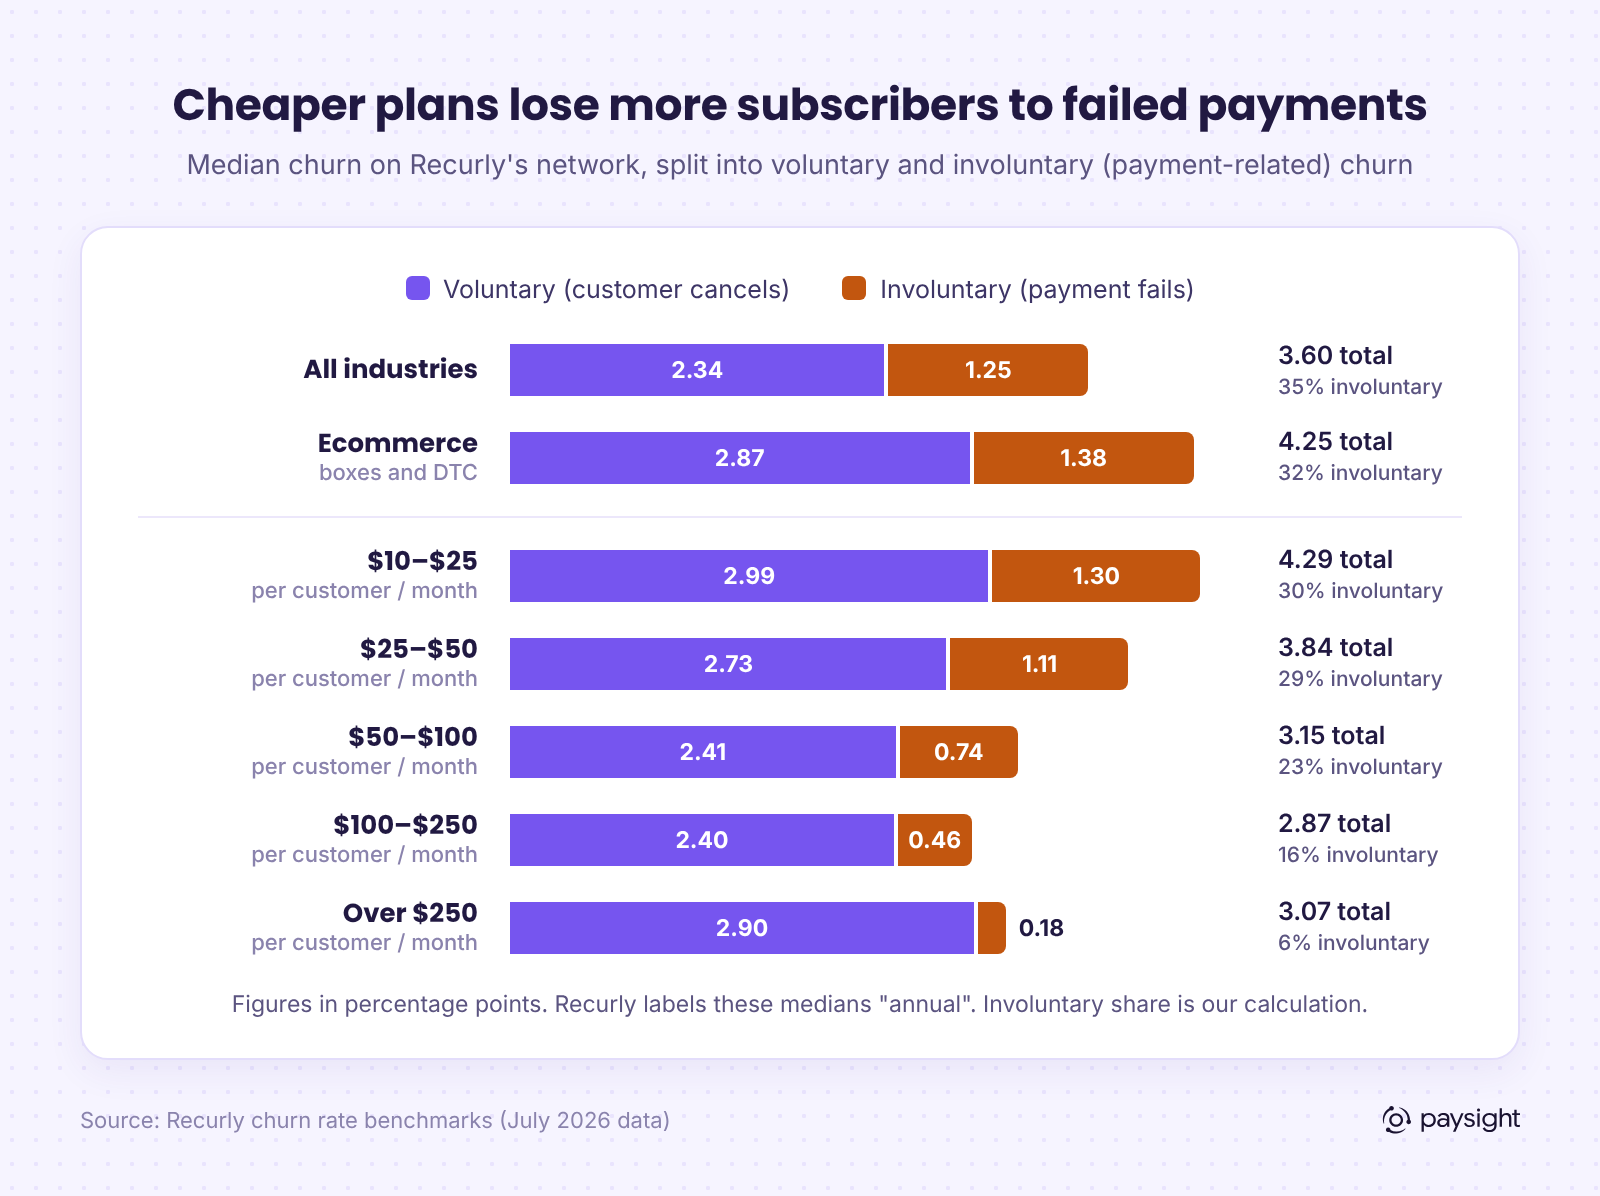
- About a third: involuntary churn is 1.25 of Recurly's 3.60 points overall (35%) and 1.38 of 4.25 points in ecommerce (32%). The shares are our calculation from Recurly's July 2026 benchmarks.
- 1.30% vs 0.18%: involuntary churn on plans at $10 to $25 a month, against plans over $250 (Recurly, July 2026).
- 7%: of recurring charges fail on the first attempt on Recharge (Recharge, Feb 2026).
- 96%: Recurly's renewal invoice paid rate in 2023, so about 4% of renewals went unpaid (Recurly, Jan 2024).
- $129 billion: Recurly's projection of revenue subscription businesses would lose to involuntary churn in 2025 (Recurly, Jan 2024).
- About 7 months: how much longer a recovered monthly subscription lasts on average, in Stripe's data (Stripe, Nov 2024).
- $169.4 million: what ecommerce brands on Recurly recovered through dunning in 2025 (Recurly, 2026).
- 70% and 42%: in Churnkey's 2024 data, 70% of detected involuntary churn was recovered, and dunning emails and SMS alone recovered 42% (Churnkey, 2025).
- About 40%: of cardholders replaced their cards in 2022 because of expiry, loss or fraud. Every replaced card on file is a renewal at risk (Stripe, Feb 2023).
- 29%: of all Visa transactions used tokens in mid-2024, and Visa says tokenization can cut fraud by up to 60% (Visa, Jun 2024).
- 3% and 28%: Visa measured a 3% increase in approval rates and a 28% reduction in fraud for token transactions (Visa, Aug 2022).
- 3 to 6 points: the average approval-rate improvement for tokenized transactions, per Mastercard and Checkout.com (Mastercard, May 2026; FY2025 data).
- Almost half: of Mastercard's card-not-present transactions in Europe were tokenized in April 2025 (Mastercard, Jun 2025).
Recovery claims from billing vendors are useful as a range, but each one measures its own customers with its own definition:
For the mechanics behind these numbers, see our guides to soft vs hard declines and network tokens for subscriptions.
What these numbers mean for a subscription brand in 2026
Spend on the first two renewals
Recharge's data puts most voluntary churn at the first two renewals. Onboarding, the first reorder experience and the option to skip or delay are worth more than another discount on the first order.
Make leaving easy, and pausing easier
The Chargebee and Recurly numbers point the same way: easy cancellation makes people more willing to subscribe, and a visible pause option keeps a quarter of would-be cancellers. Three in four who pause come back.
Treat failed payments as a churn line of their own
About a third of churn on Recurly's network is involuntary, and it is highest on low-priced plans, which is where most replenishment subscriptions sit. Retry timing, card updater coverage, network tokens and a second gateway for processing-side outages all reduce it.
Quote market sizes carefully
If a pitch deck or board update cites "the subscription market," name the firm, the year and the definition. The estimates in this article range from $393 billion to $2.72 trillion for the same year.
Where Paysight fits
Paysight is a platform to launch and manage subscriptions on the gateways and merchant accounts you already have, such as Stripe, NMI or Finix. It is not a payment processor: your gateways and acquirers still approve, settle and hold the funds.
What Paysight adds is one place for subscription, transaction and customer data, so you can see churn by cause rather than as one number. It runs retries and routing across the gateways you connect, uses card account updater to refresh stored cards, and gives customers a care portal to pause, skip or change their plan instead of cancelling.
Sources
- Juniper Research: Subscription economy to reach $1.2 trillion by 2030 (1 Oct 2025)
- Fortune Business Insights: Subscription e-commerce market (updated Oct 2026)
- IMARC Group: Subscription e-commerce market (updated Jul 2026)
- Global Market Insights: Subscription box market (Sep 2026)
- Zuora: Subscription Economy Index and Harris Poll consumer survey (15 Apr 2025)
- Zuora Subscribed Institute: consumer research on cancelling and rejoining (Dec 2024)
- Recurly: State of Subscriptions 2026 (2026)
- Recurly: 2026 State of Subscriptions press release (14 Jan 2026)
- Subscription Insider: Recurly's annual State of Subscriptions (Jan 2026)
- Recurly: Churn rate benchmarks (July 2026 data)
- Recurly: 2026 State of Subscriptions, Ecommerce (2026)
- Recurly: 2025 State of Subscriptions press release (16 Jan 2025)
- Recurly: 2024 State of Subscriptions press release (23 Jan 2024)
- Recurly: Failed payments could cost subscription companies more than $129 billion in 2025 (9 Jan 2024)
- Recurly: Failed payment recovery (undated, checked Nov 2026)
- Recharge: Recharge welcomes Skio (27 Apr 2026)
- Recharge: Subscription Trend Report 2026 (Jun 2026)
- Recharge: Subscription churn is front-loaded (Jul 2026)
- Recharge: Evolution of the routine economy (May 2025)
- Recharge: Subscriber Trends and Insights report (17 Sep 2024)
- Recharge: Cancellation prevention (Feb 2026)
- Recharge: Failed payment recovery (Feb 2026)
- Ordergroove: New business growth of 152% (28 Mar 2024)
- UK Department for Business and Trade: New measures to crack down on subscription traps (18 Nov 2024)
- McKinsey: Thinking inside the subscription box (Feb 2018)
- WFSB: Average American now spending $111 a month on subscriptions (CNET survey) (16 Jul 2026)
- ABC7: Americans wasting money on unused subscriptions (CNET report) (Jul 2026)
- C+R Research: Subscription service statistics and costs (May 2022)
- Bango: From forever subscriptions to vampire subscriptions (17 Sep 2024)
- Chargebee: Cancel anytime consumer survey (23 Sep 2025)
- Motley Fool Money: Survey on overpaying for subscriptions (Mar 2024)
- Deloitte: 2025 Digital Media Trends (25 Mar 2025)
- Churnkey: State of Retention 2025 (2025)
- Harvard Business Review: The value of keeping the right customers (29 Oct 2014)
- Stripe: Billing (2025 data, checked Nov 2026)
- Stripe: Subscription business leaders are looking for a better way to combat churn (13 Nov 2024)
- Stripe: Network tokens and card account updater (23 Feb 2023)
- Visa: Tokenization press release (4 Jun 2024)
- Visa: Token approval and fraud analysis (24 Aug 2022)
- Mastercard and Checkout.com: Tokenization report (7 May 2026)
- Mastercard: Tokenization in Europe (3 Jun 2025)
It depends on the definition. Juniper Research puts the global subscription economy at $722 billion in 2025, rising to $1.2 trillion by 2030. Estimates for subscription ecommerce alone range from $393 billion (IMARC Group) to $2.72 trillion (Fortune Business Insights) for 2025. When you quote a figure, name the firm, the year and what it measures.
Recurly's July 2026 benchmarks put median ecommerce churn at 4.25%, made up of 2.87% voluntary and 1.38% involuntary churn, against 3.60% across all industries. Recurly labels these medians annual, so check the period before comparing them with your own monthly figure. Churn also falls as plan prices rise.
Early. Recharge's July 2026 analysis found 24.1% voluntary churn at the first renewal and 27.1% at the second, falling to 2.4% from the 13th renewal on. About 61% of voluntary cancellations happen at the first two renewals, so the first reorder experience matters more than most acquisition tweaks.
On Recurly's network, involuntary churn is 1.25 of 3.60 churn points across all industries and 1.38 of 4.25 points in ecommerce, or roughly a third of all churn. The share is higher on low-priced plans: 1.30 points on plans at $10 to $25 a month against 0.18 on plans over $250.
Vendor figures give a range. Stripe says businesses using it recover 55% of failed payments on average, Recurly reports a 49% average dunning recovery rate, and Churnkey recovered 70% of detected involuntary churn in its 2024 data. Each vendor measures its own customers, so treat these as a range rather than a benchmark.
The data suggests it does. Recurly found that 25% of subscribers paused instead of cancelling where a pause option was offered, and that 75% of customers who pause eventually return. In Chargebee's 2025 survey, 78% of consumers said they want to pause or swap and 58% had paused instead of cancelling.
No. Paysight is a platform to launch and manage subscriptions on the gateways and merchant accounts a brand already has, such as Stripe, NMI or Finix. It keeps subscription, transaction and customer data together, runs retries and routing across the connected gateways, and offers card account updater and customer care portals.










Company Reg. No. 760371
VAT No. IE4280069RH


