


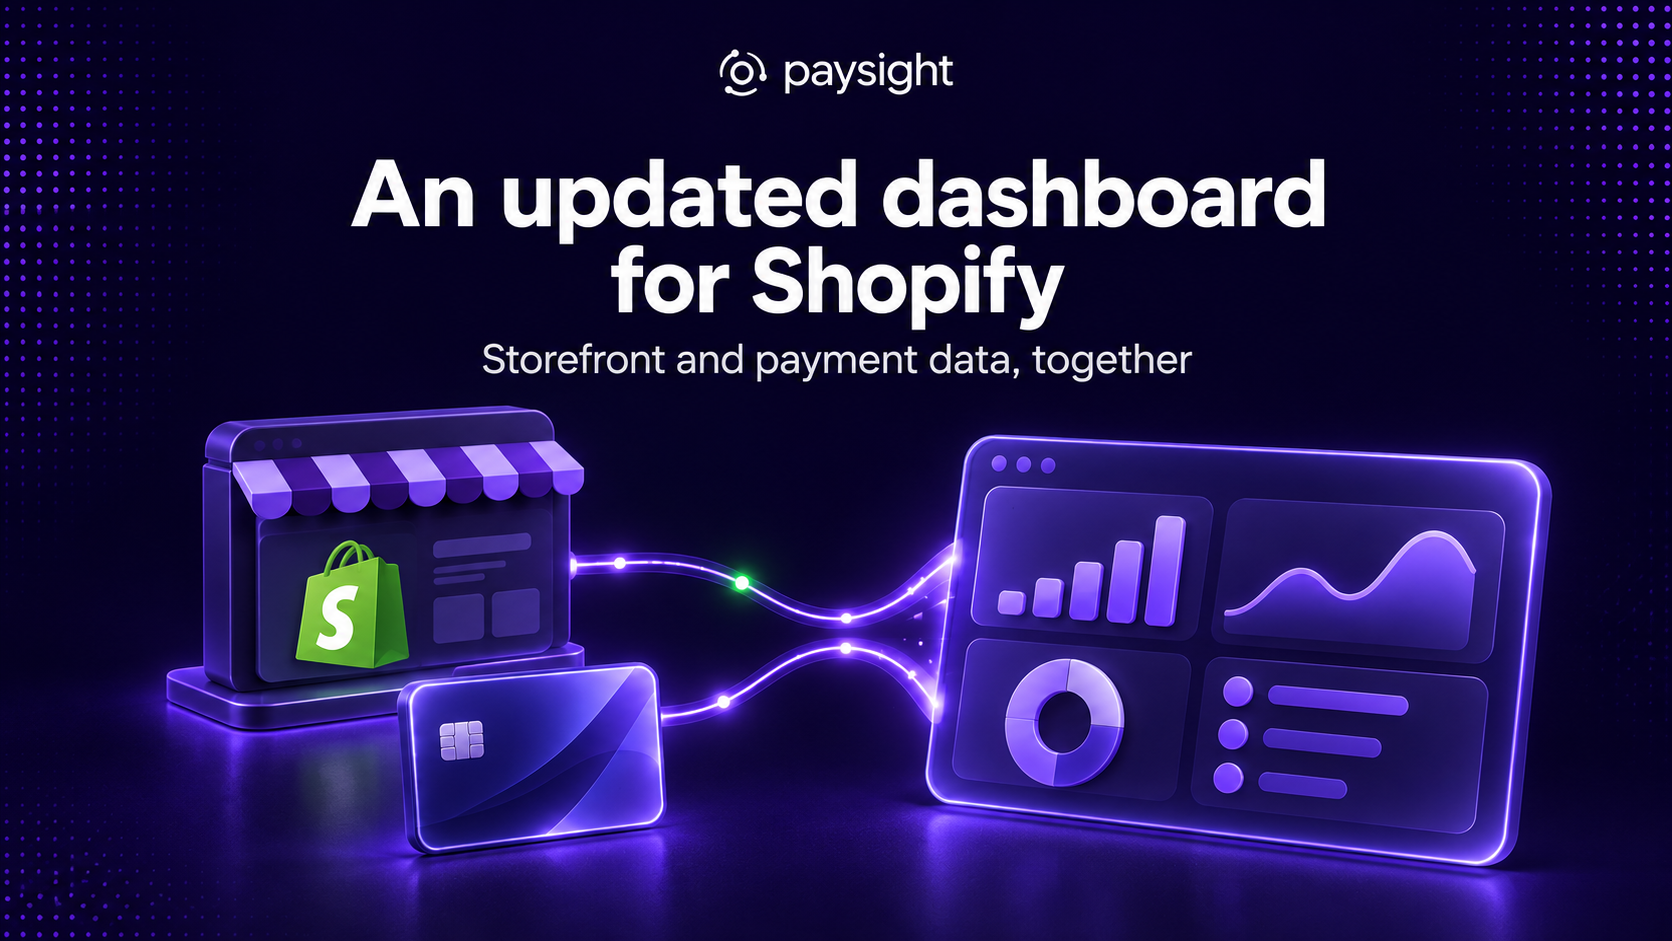
We've updated the Paysight dashboard for Shopify merchants, bringing Shopify storefront data together with the checkout and payment data collected by Paysight.
This dashboard focuses on one-time sales, including upsells. Subscription and rebill data remain in the separate reports.
The dashboard connects what happens in your store with what happens as customers move through checkout. You can follow the journey from a visit to a completed purchase, explore how different campaigns and products perform, and investigate where customers run into problems.
Start with the overview, then follow the detail
The overview brings together store visits, add-to-cart activity, checkout visits, orders, upsells, revenue, and average order value. Charts show how those metrics change over your selected period, while the customer journey view shows how visitors progress towards a purchase.
From there, you can explore dedicated tabs for Decision Metrics, Journey, Abandonment, Traffic, Sales, Products & offers, Tracking, and Activity.
The Products & offers tab lets you examine upsell performance and its impact on average order value.
You might start with a change in checkout conversion, look at the traffic behind it, and then examine what happened to those visitors during checkout. The different views give you room to follow that question.
Use the data to narrow your view
Filtering is central to how the dashboard works. Data points within the reports can become filters, letting you narrow the dashboard around the segment you want to understand.
For example, you can start with a campaign, then narrow the view by country or device. The dashboard reflects that selection, so you can explore the journey and results for that group of visitors.
That makes it easier to evaluate channels, campaigns, products, and offers in context. A source bringing in plenty of visitors is worth looking at alongside the purchases those visitors complete. A weaker result gives you a reason to look more closely at where the journey changes.
Look at abandonment and checkout issues in more detail
The Abandonment tab shows where abandoned checkouts stopped, how many later recovered, the recovered revenue, and how long recovery took. It also shows common paths for completed and abandoned checkouts.
Tracking adds another part of the picture: whether visitors reach Paysight checkout successfully, how long redirects take, and whether payment or connection issues appear along the way. Coverage checks highlight gaps such as untracked checkout starts.
When you need to inspect a specific sequence, the Activity tab brings together storefront and checkout events. You can follow actions such as a checkout click, redirect, completed shipping details, or a customer leaving the page.
These views help you identify where to investigate when performance changes, including issues that might otherwise get lost in an overall conversion figure.
Built for a closer look at your Shopify store
The updated dashboard is designed for Shopify merchants who want to explore their store data alongside the additional detail Paysight collects.
Use it to find promising campaigns and offers, understand how customers move towards a purchase, and spot friction worth addressing. You can start with the overall picture and keep narrowing the view as new questions come up.
No. This dashboard focuses on one-time sales, including upsells. To review subscriptions and rebills, continue using the dedicated reports in Paysight. We plan to bring these views together in the future.
MID status, capacity, and management remain in the separate MID reports and tools. You'll still use those to review your merchant accounts alongside this dashboard.
No. It's included in Paysight's standard dashboards, with no additional dashboard fee.
Setup is quick, and the Paysight team can help you get it connected if you need a hand. Contact us for help getting started.
Yes. The dedicated Products & offers tab includes upsell performance and its impact on average order value (AOV), so you can see how your offers contribute to each purchase.
Data points within the reports can be used to narrow the dashboard to a particular segment. For example, you can explore a campaign and then add a country or device filter to examine the journey and results for that group of visitors.


.svg)


%25201.jpeg)
.png)

Company Reg. No. 760371
VAT No. IE4280069RH


